What’s With the Bands on BBG’s Trees?
In consultation with Andrew Reinmann, an ecologist and biogeochemist at CUNY, Brooklyn Botanic Garden has installed dendrometers—which measure tree growth—around the grounds in a demonstration for visitors.
There’s so much we still don’t know about trees and how they’re reacting to our rapidly changing world. But we can learn a lot through their growth patterns, which shift depending on environmental conditions like temperature, rainfall, and light exposure. Scientists use dendrometers to better understand how trees are responding to stress, how much carbon dioxide they’re pulling out of the atmosphere, and more.
Garden staff installed two different types of dendrometers on trees. The first, band dendrometers, are simple measuring tape-like instruments that have been used by scientists for decades. As the tree sequesters carbon and builds biomass, expanding its trunk over time, the tape expands, too. The second is called a point dendrometer, a tool that’s newer to science. Point dendrometers can log new data every 15 minutes or so, and are able to record the tiny, imperceptible swells and contractions that reshape a tree’s trunk throughout the day as water flows through it.
These tools can provide scientists with complementary bits of information about trees. By analyzing these measurements over time, researchers can start to determine how trees are responding to environmental changes.
The thing is, although they may appear sedentary, “trees aren’t static organisms,” says Reinmann. A flurry of dynamic processes are going on inside of them all the time, at various timescales.
Reinmann’s own research focuses on plant ecophysiology and the terrestrial carbon cycle. In 2022, he received a five-year National Science Foundation CAREER grant to study how climate change and forest fragmentation affect carbon sequestration in temperate forests.
By installing dendrometers at Brooklyn Botanic Garden, “I hope that visitors will start to look at trees as organisms that are active and engaged in the world, much like people are,” he says.
Though we aren’t conducting a formal scientific experiment, our Horticulture team and volunteers will be recording data regularly over a period of several years. We hope to better understand how much carbon the trees at Brooklyn Botanic Garden might be sequestering, and how they’re responding to our changing climate. We also want to get to know our trees as individuals—how they shift, grow, and react to their environment over time.
What We’ve Learned So Far
Since this is a demonstration conducted largely by staff and volunteers, we expect a bit more variability and human error than you might see in a formal study. Still, results thus far offer a fascinating glimpse into the active, dynamic lives of trees.
Below are visualizations of data collected from a linden tree (Tilia cordata ‘Greenspire’) and an American beech tree (Fagus grandifolia). Both are relatively young trees, acquired by Brooklyn Botanic Garden in 2013 and 2001, respectively. To give a sense of their size, both trees had a DBH (diameter at breast height) of roughly eight inches, or 20 centimeters, when they were last measured in 2021.
Scroll along the graphs below to watch these trees swell, contract, and grow over time.
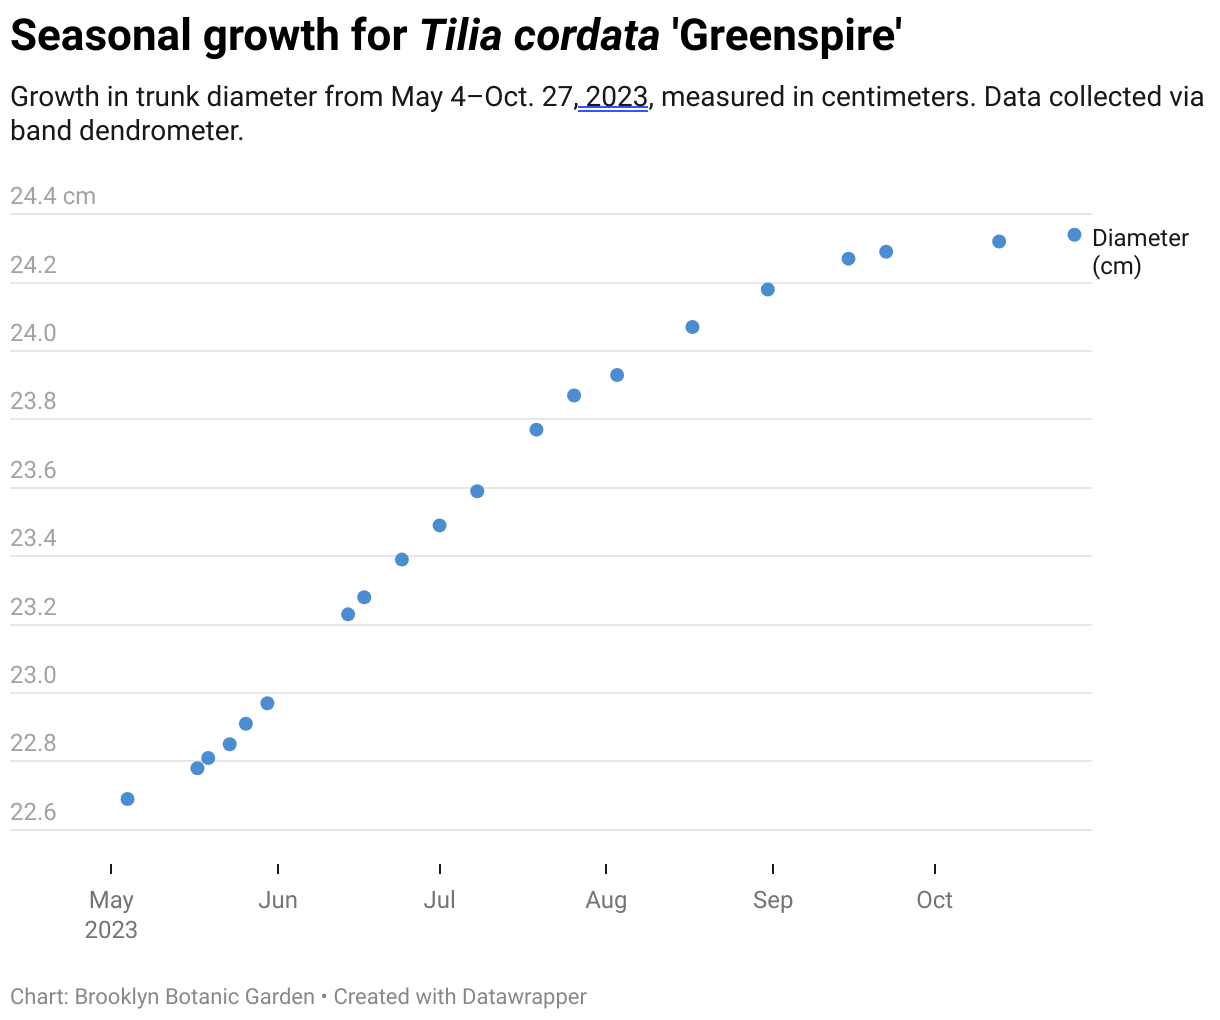
The graph above visualizes measurements taken over the last several months. This band dendrometer was installed on a littleleaf linden tree cultivar (Tilia cordata ‘Greenspire’) located on the southwest end of the Osborne Garden.
Band dendrometers measure changes in trunk diameter, which helps scientists understand how quickly a tree is growing on a roughly week-by-week basis. Our data suggest that this tree grew a lot over the summer—nearly 1.5 centimeters in diameter, to be exact!
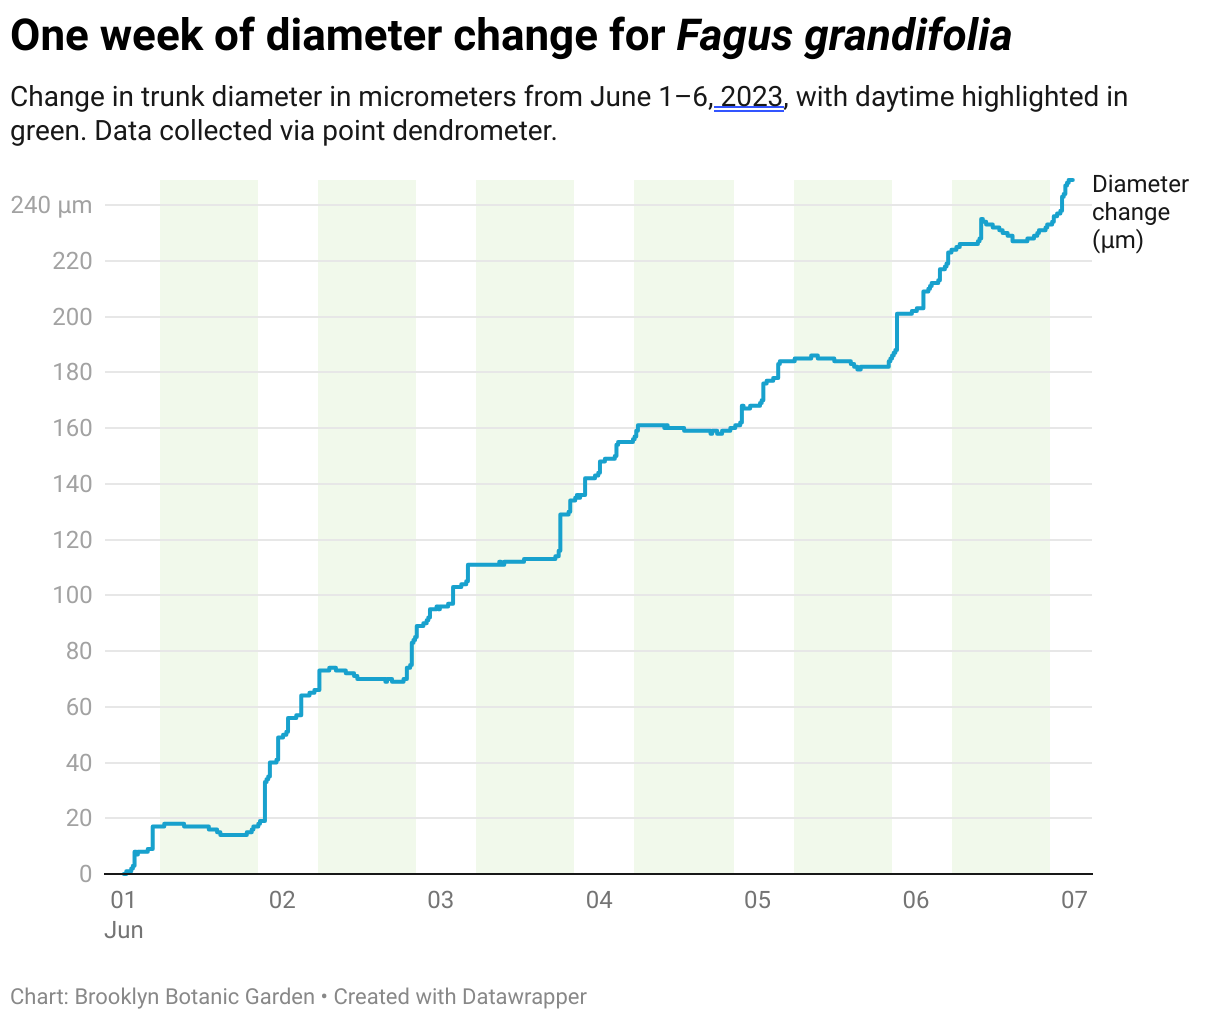
This next graph, above, was created using data from a point dendrometer, a digital tool that can measure tiny shifts in trunk diameter down to the micrometer (that’s 1/1000th of a millimeter). This dendrometer was installed on an American beech tree (Fagus grandifolia) in Bluebell Wood.
A tree’s diameter typically contracts in the afternoon as water gets drawn up through the trunk, then expands again at night. BBG advisor Andrew Reinmann calls this daily pattern the “heartbeat” of a tree.
If you scroll along this sample week, you can watch as this beech tree’s trunk exhibits this diurnal pattern, while continuing to grow overall.
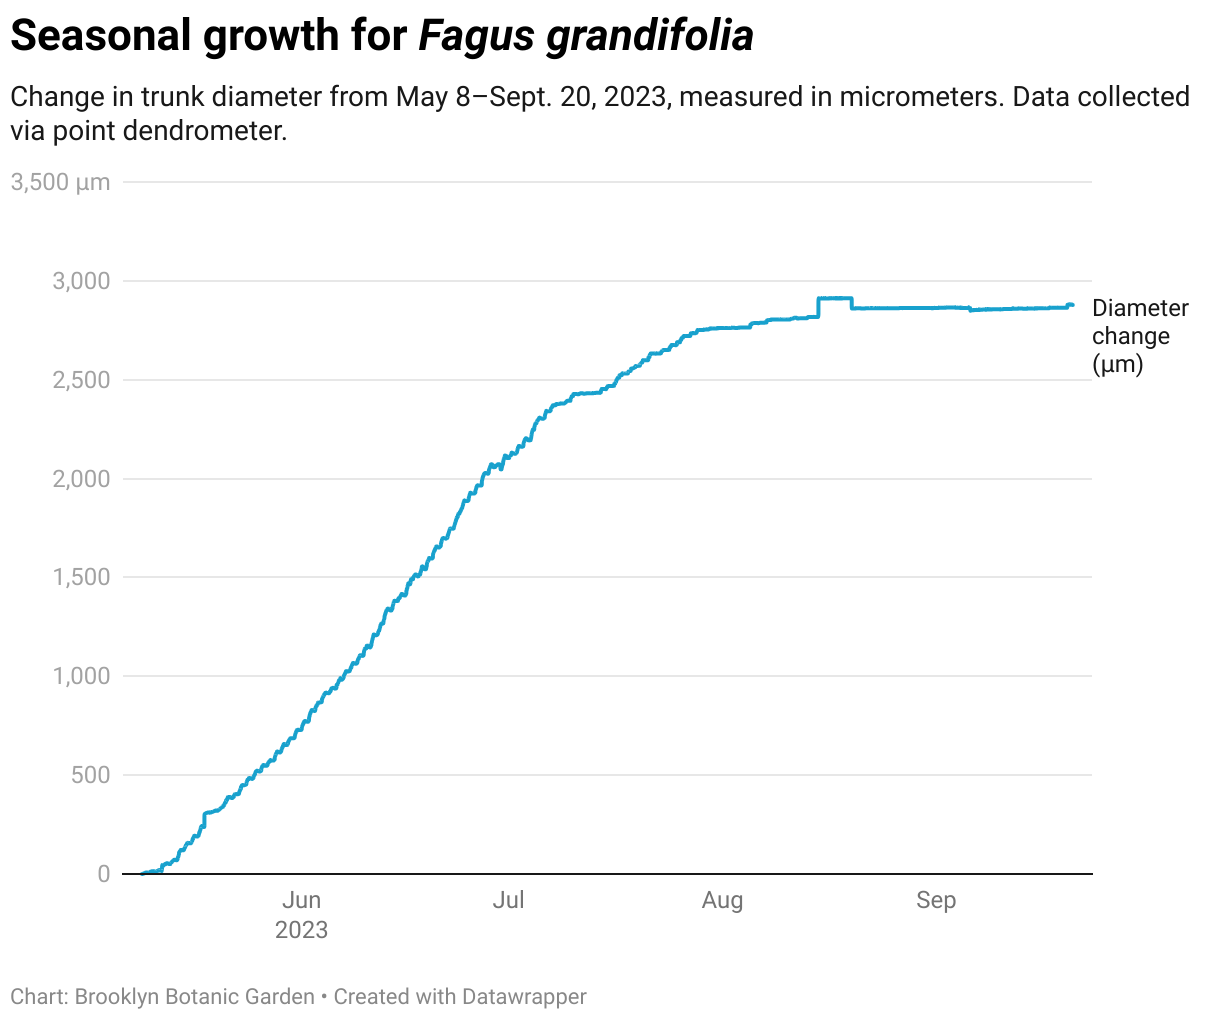
In addition to daily patterns, point dendrometers also measure overall growth over time, as seen in this last graph above.
Scroll along as the American beech tree grows steadily in May and June, then starts to level off during the hotter months of July, August, and early September. (That bump in August? We think the dendrometer got jostled.)
Thanks for following along!